Streamlit love - making apps has never been easier for data scientist
Streamlit for beginners

Hi everyone! Hanh here. I'm a data scientist with a master degree in business and informatics. I am also interested in software development and web development, because I love to build beautiful and functional things. I am learning and would like to share what I learn.
What is streamlit and why I like it?
Streamlit is an open-source Python library which allows users to quickly create beautiful user interfaces for their machine-learning models and data visualisations using only a few lines of code. Streamlit provides a range of features, such as authentication, data sources, and web deployment. As a Python library itself, Streamlit supports popular Python libraries like NumPy, Pandas, Scikit-Learn and TensorFlow which makes it easier for developers to build powerful machine-learning models into their applications.
Streamlit comes with a wide range of components which are the building blocks for making web apps, such as Text Input and Output, Buttons, Select Boxes, Sliders, Date Pickers, File Upload, Plotting and Visualization and more.
Installing and getting started
Since Streamlit is a Python library, you can install it using any Python package manager or through the terminal with pip.
pip install streamlit
Create a new directory for your project and enter its path on the command line to begin. Make the "app.py" file (you can name the file whatever you like but remember to be consistent throughout following this article) and then open it in your editor. The code for our demo machine-learning app will be written here.
import streamlit as st
st.write("Hello, World!")
Navigate your terminal to be in the correct project directory and your virtual environment (if any) is active, then enter the following command to run the app.
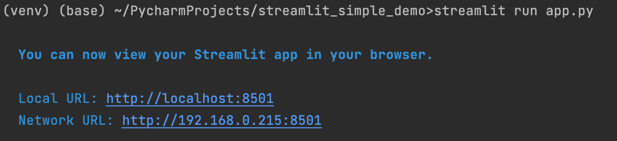
streamlit run app.py
If everything is set up correctly, a Streamlit server will be launched, and links to the app will be displayed, as shown below:
Building an Insurance Prediction Application
We will build a simple data science project based on a dataset available in Kaggle. Place the csv file in the same level as of app.py file since it is just a simple application.
Creating a menu bar
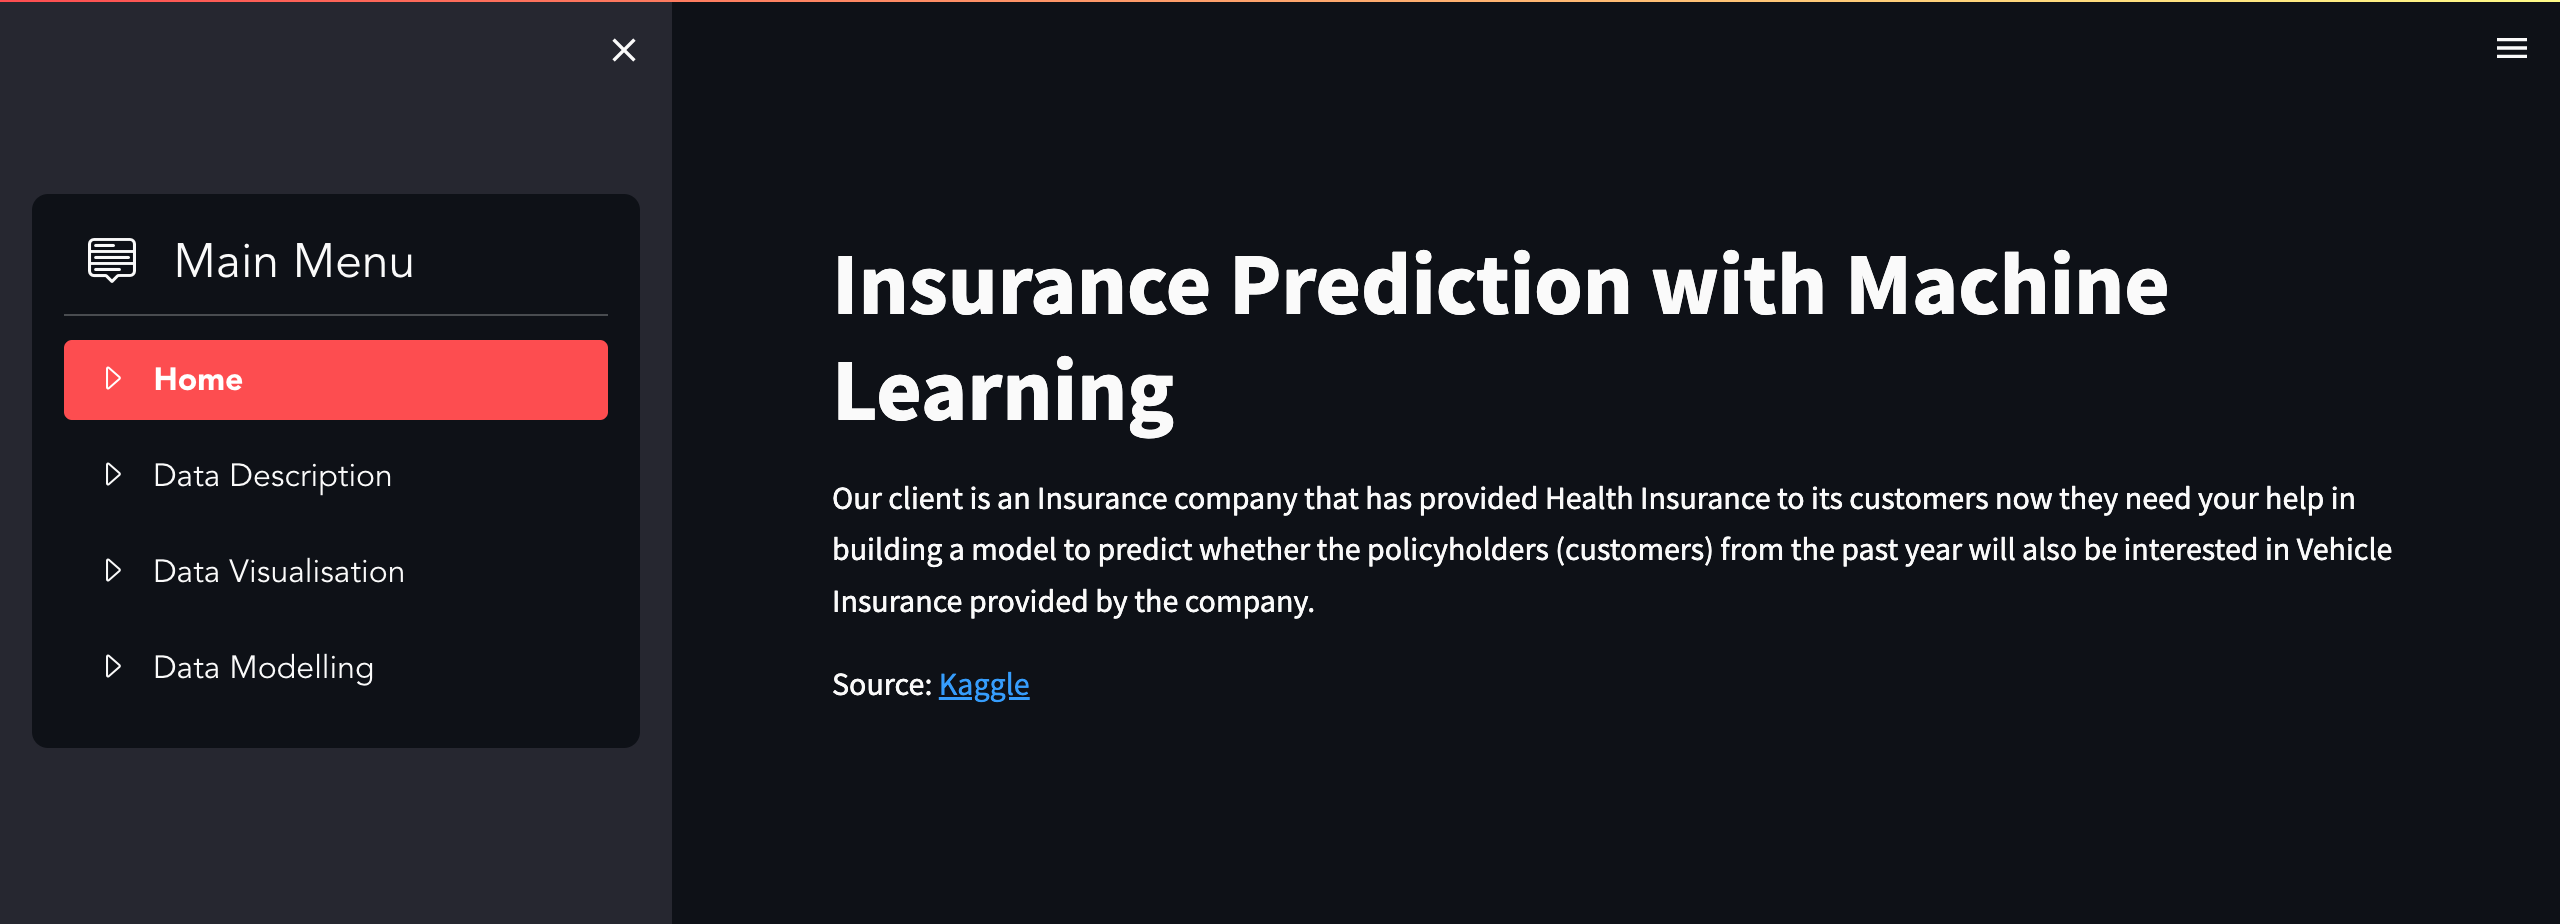
You can create the structure of page with menu navigation bar on the left and content page on the right, so when you navigate by clicking the tab it will bring you to the next content. In our case, we have Home, Data Description, Data Visualisation and Data Modelling in the navigation menu.
We can achieve this by writing some streamlit/python codes:
from streamlit_option_menu import option_menu

# Set page config with a sidebar
st.set_page_config(layout='wide', initial_sidebar_state='expanded')

# set up the sidebar
with st.sidebar:
    selected = option_menu(
        menu_title="Main Menu",
        options=["Home", "Data Description", "Data Visualisation", "Data Modelling"]
    )
We first need to set the page configuration to include a sidebar with st.set_page_config(). Noticeable that we are using the option_menu component from Streamlit to set up the navigation bar, but of course here we can also use the st.selectbox() as well to display different options. I found that option_menu gives better aesthetics and saves you lot of time. Remember to install it in before import it into your Python script:
pip install streamlit-option-menu
Display simple text and table
To display simple text as you see in the home landing page, you simply need to wrap everything inside the command st.write() as below.
st.write("Our client is an Insurance company that has provided Health Insurance
to its customers now they need your help in building a model
to predict whether the policyholders (customers) from the past year
will also be interested in Vehicle Insurance provided by the company.")
If you have a dataframe and want to show some first rows as we always do when we analyse the data, you can pop it into st.write() and it will do the magic.
st.write(df.head())
Display pictures
In the Data Description part, a picture is displayed by combining the Image function from the Pillow library (PIL) and st.image from streamlit. Sample code is as follow:
from PIL import Image
# add an image
image = Image.open('data_description.png')
st.image(image, caption='Data Description')
Display visualisations
Streamlit supports visualisation packages like matplotlib, seaborn and plotly. Just build your graphs with your favourite library as usual and put them in a fig, after that use the st.write(fig) function to display it.
st.subheader('Correlation Heatmap')
sns.set(font_scale=0.5)
fig, ax = plt.subplots()
plt.figure(figsize=(20, 17))
matrix = np.triu(df.corr())
sns.heatmap(df.corr(),
                ax=ax,
                annot=True,
                linewidth=.8,
                mask=matrix,
                cmap="rocket")
st.write(fig)
Display interactive content with buttons
As you can see from the Data Visualisation and Data Modelling, we can integrate the interactive content by adding radio buttons or drop-down. By choosing a value from radio button, the content will be updated respectively.
# Compare and display chosen model
chosen_model = st.radio('Please select to model to see its performance:',
                            ("LogisticRegression",
                             "DecisionTreeClassifier",
                             "RandomForestClassifier"))

st.write('You selected:', chosen_model)
if chosen_model == "LogisticRegression":
    model = log_reg
elif chosen_model == "DecisionTreeClassifier":
    model = tree
elif chosen_model == "RandomForestClassifier":
    model = forest
else:
    st.write("You didn't pick any model.")
If you go to the documentation of streamlit, you will find more of these input widgets such as slider, text input and even drag/drop area. To use it, simply call st.radio() or st.selectbox() and put the options inside the bracket. After that, a condition can be set up to dymically use of the chosen option by users.
Deploying Streamlit app
The site can be viewed from your localhost, however you want to publish and share over the internet. You will need a GitHub account, a streamlit account and et voila you can deploy your web app to the internet.
For quick integration with your GitHub account, on creating Streamlit account on [Streamlit website](https://share.streamlit.io/), choose "Continue with GitHub". Use the Single Sign On (SSO) service to allow Streamlit to access your GitHub profile.
Click "New app" and enter the details of your repository, the branch and the main file path (just like I did mine). You can also copy and paste your project's GitHub URL directly.
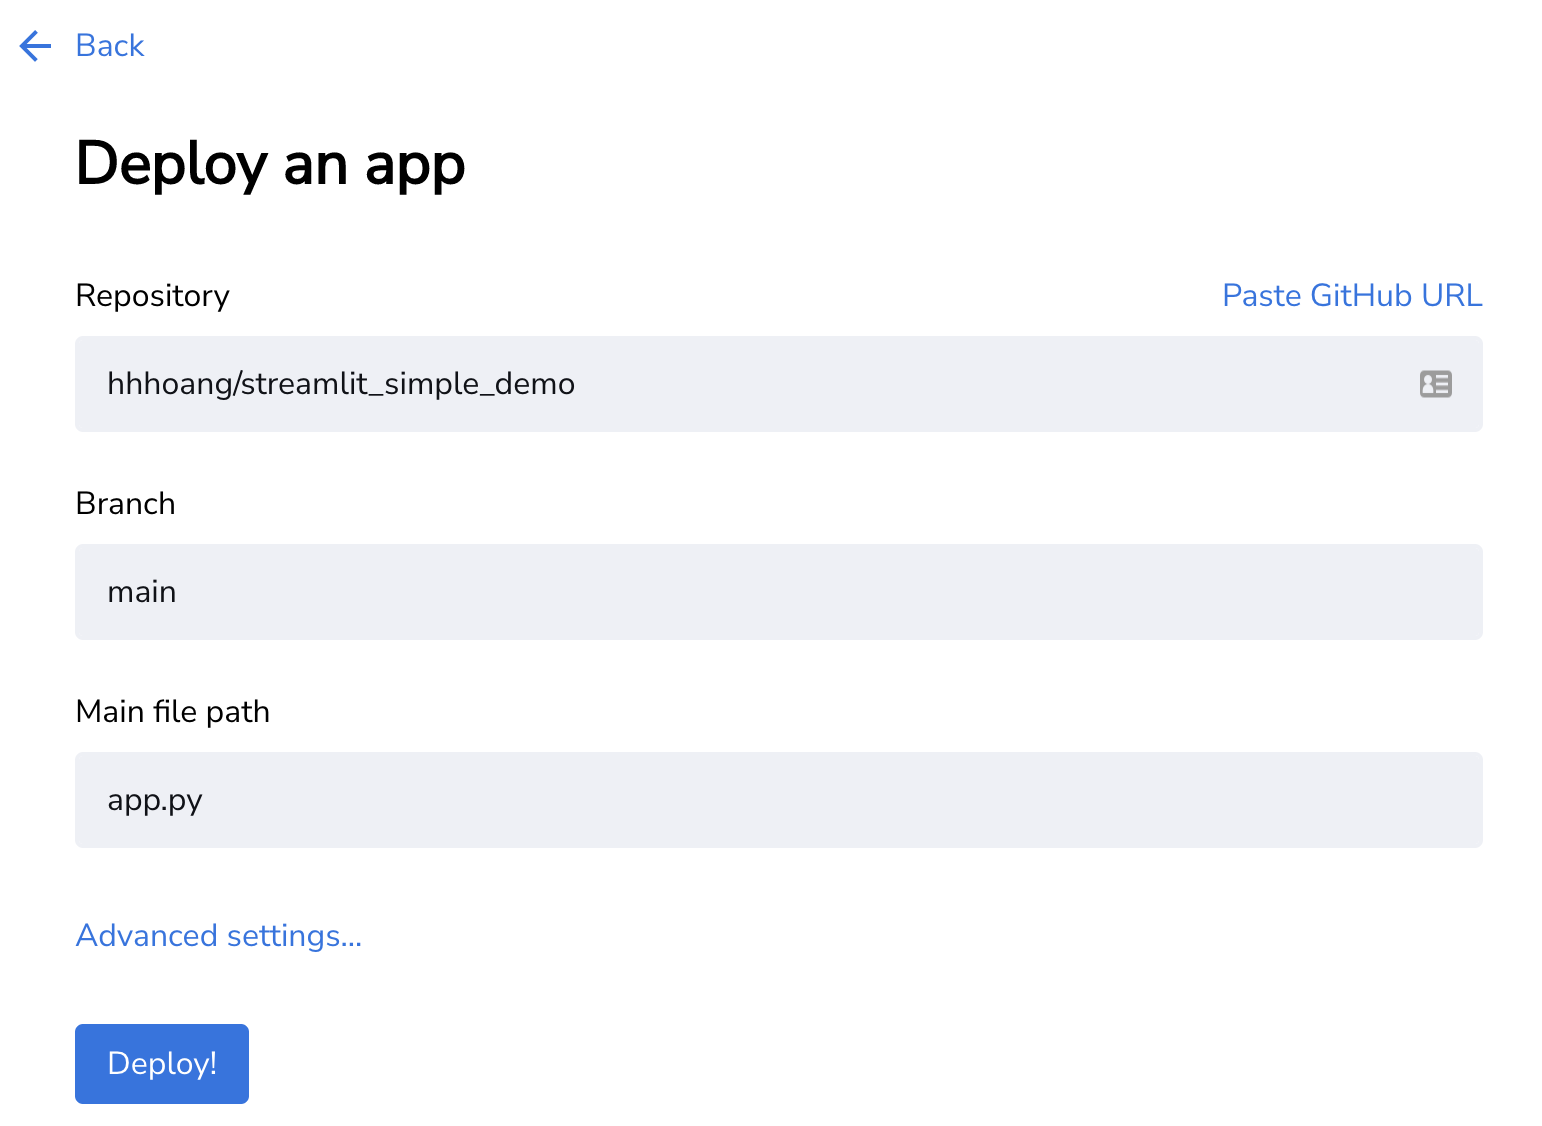
Click "Deploy" and wait for the magic! Your app will be loaded in a few seconds, and you can share the URL. Any changes you push to your GitHub repository will be automatically updated on the application.
Resources
The code is available on GitHub
The demo site is available on Streamlit


